
Weather Prediction
When predicting the weather, it is important for your system to yield uniformly good performance across all climates. Weather prediction model should also be robust to shifts in weather patterns in the future.
Unfortunately, training data is rarely uniformly distributed across different climate zones, as there are regions which are sparsely covered with ground weather stations. Furthermore, weather systems (the movements of air) are highly non-stationary processes, making it increasingly difficult for models to yield accurate predictions as time goes on. Thus, weather prediction models often encounter shifts in climate and degrading performance over time. We would like the models to be more robust to these effects and also to yield uncertainty estimates, which allow users to know when the weather forecast is accurate.

Data & Task
This competition will feature a tabular heterogeneous weather prediction dataset provided by the Yandex.Weather service: pairs of features (sun evaluation at the current location, climate values of temperature and atmospheric pressure, and climate model predictions) and temperature measurements at a particular latitude/longitude and time, with 111 features in total.
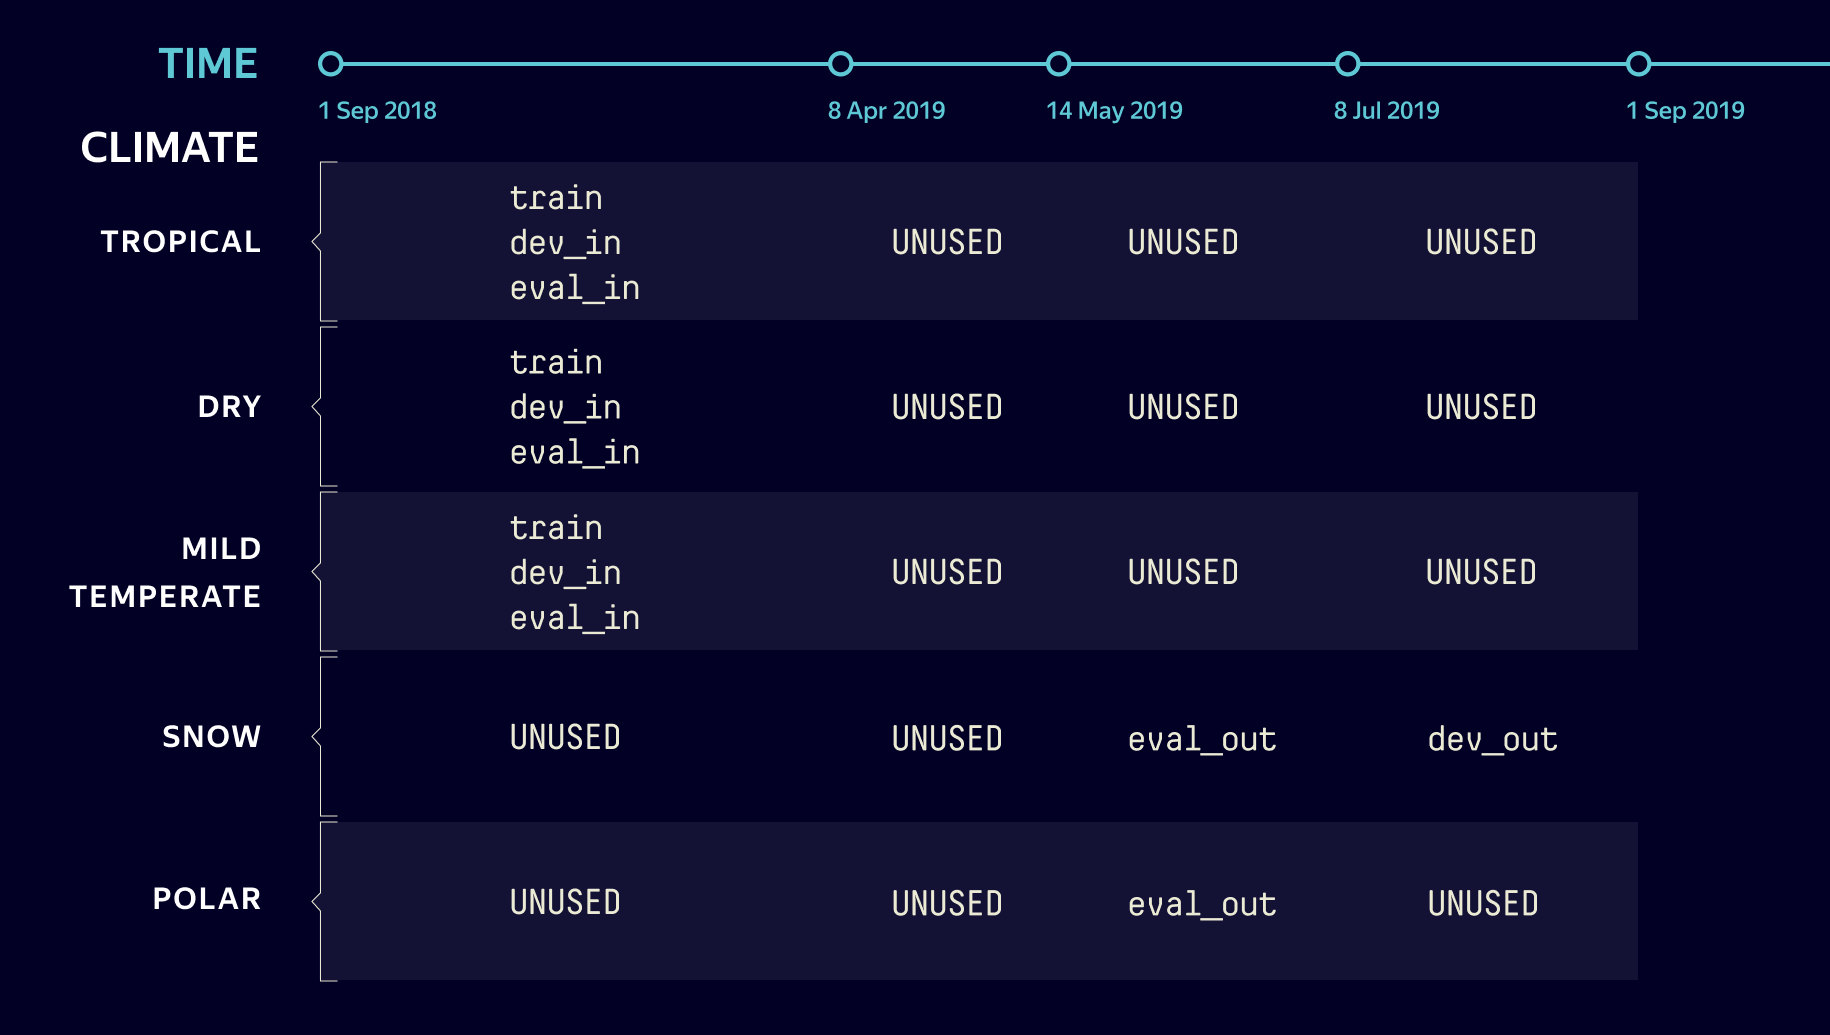
There are 10M records in the dataset made uniformly between September 1, 2018 and September 1, 2019. The training data consists of measurements made from September 2018 through July 1, 2019.
The goal is to predict the temperature at a particular latitude/longitude and time, given all available measurements and climate model predictions.
To test the robustness of the models, we will evaluate how well they perform on time-shifted data, e.g. in the month after the training interval (July 1 — August 1, 2019).

Metrics
As weather prediction is a scalar regression task, to assess the quality of the submitted models we will use mean-squared error (MSE), the standard metric for assessing (and training) regression models, and mean absolute error (MAE).
To assess the joint quality of uncertainty estimates and robustness, we will use the area under a retention curve (R-AUC) as the competition score. Here, predictions are replaced by ground-truth targets in order of descending uncertainty, which decreases the MSE. Area under the curve can be reduced either by improving performance or by the uncertainty-based rank-ordering, so that bigger errors are replaced first. This will be the target metric used to rank participants’ submissions to the weather prediction track. All metrics will be evaluated jointly on in-domain and shifted data.
For the participants’ benefit and to obtain greater insights, we provide additional metrics for assessing models. Shifted-data detection performance will be evaluated using ROC-AUC. We also introduce two F1-based metrics, called F1-AUC and F1 @ 95%, which jointly evaluate the quality of uncertainty and predictions. These are also computed using MSE as the error metric. These metrics do not affect leaderboard ranking.
Further details of all metrics are provided on GitHub and in our paper.
Leaderboard
| Rank | Teamname/ username | Method Name | Score (R-AUC MSE) | RMSE | MAE | AUC-F1 | F1 @ 95% | ROC-AUC (%) | Date Submitted |
|---|
