TabDDPM: modelling tabular data with diffusion models

Denoising diffusion probabilistic models are currently becoming the leading paradigm of generative modeling for many important data modalities. In this post, we share some findings on application of diffusion models to tabular data
[1]. We introduce TabDDPM — a diffusion model that can be universally applied to any tabular dataset and handles any type of feature (numerical and categorical).

Generating tabular data The link has been copied to clipboard

First, let’s discuss why synthetic tabular data may be useful and challenging. Many research problems include tabular datasets, which are also ubiquitous in various industrial applications that include data described by a set of heterogeneous features. The demand for high-quality generative models is especially acute because of the modern privacy regulations which prevent publishing real user data, while the synthetic data produced by generative models can be shared. Also, consider a case when someone wants to use data in public competition, like Kaggle, but unable to share real records.
However, training a high-quality model of tabular data can be more challenging compared to computer vision or NLP due to the heterogeneity of individual features and relatively small sizes of typical tabular datasets. The recent works have developed a large number of models, including tabular VAEs
[2] and GAN-based approaches [2]
[3].

Evaluating quality of synthetic tabular data The link has been copied to clipboard

The most popular evaluation method is Machine Learning efficiency (or efficacy, or utility) [2], [3],
[4]. It shows the performance of classifier/regressor, that was trained on synthetic data, on real test data. Specifically, in order to evaluate the quality of the generated data $S$, we train a supervised model (in our case, CatBoost
[5]) on real train data and evalute it on real test data (getting a real score), then we train the same model on $S$ and evaluate it on the same real test data (getting a synthetic score). Finally, we compare real and synthetic score. Ideally, a synthetic score should be as close as possible to the real one (or even higher). We also compare synthetic scores between different generative models.
As for auxiliary evaluation methods, we also visualize histograms of the generated and real features. Additionally, we follow [3] and use Distance to Closest Record (DCR) metric to investigate privacy of the generate data. Essentially, it shows the mean of the closest distances between generated and real samples. So, we want this measure to be as high as possible. Otherwise, it means that there are too many samples similar to real ones which is crucial for data privacy.

Diffusion models The link has been copied to clipboard

Diffusion models [4] are likelihood-based generative models that handle the data through forward and reverse Markov processes. In short, the forward process gradually adds noise to an initial sample from the data distribution and the reverse diffusion process gradually denoises a latent variable (usually, a standard gaussian noise) and allows generating new data samples from the initial distribution. The reverse process is usally unknown and approximated by a neural network.
We combine gaussian diffusion [4] and multinomial diffusion
[6] to model numerical and categorical features, respectively. Gaussian diffusion models operate in continuous spaces where forward and reverse processes are characterized by Gaussian distributions, while multinomial diffusion are designed to generate categorical data and employs categorical distribution.

TabDDPM The link has been copied to clipboard

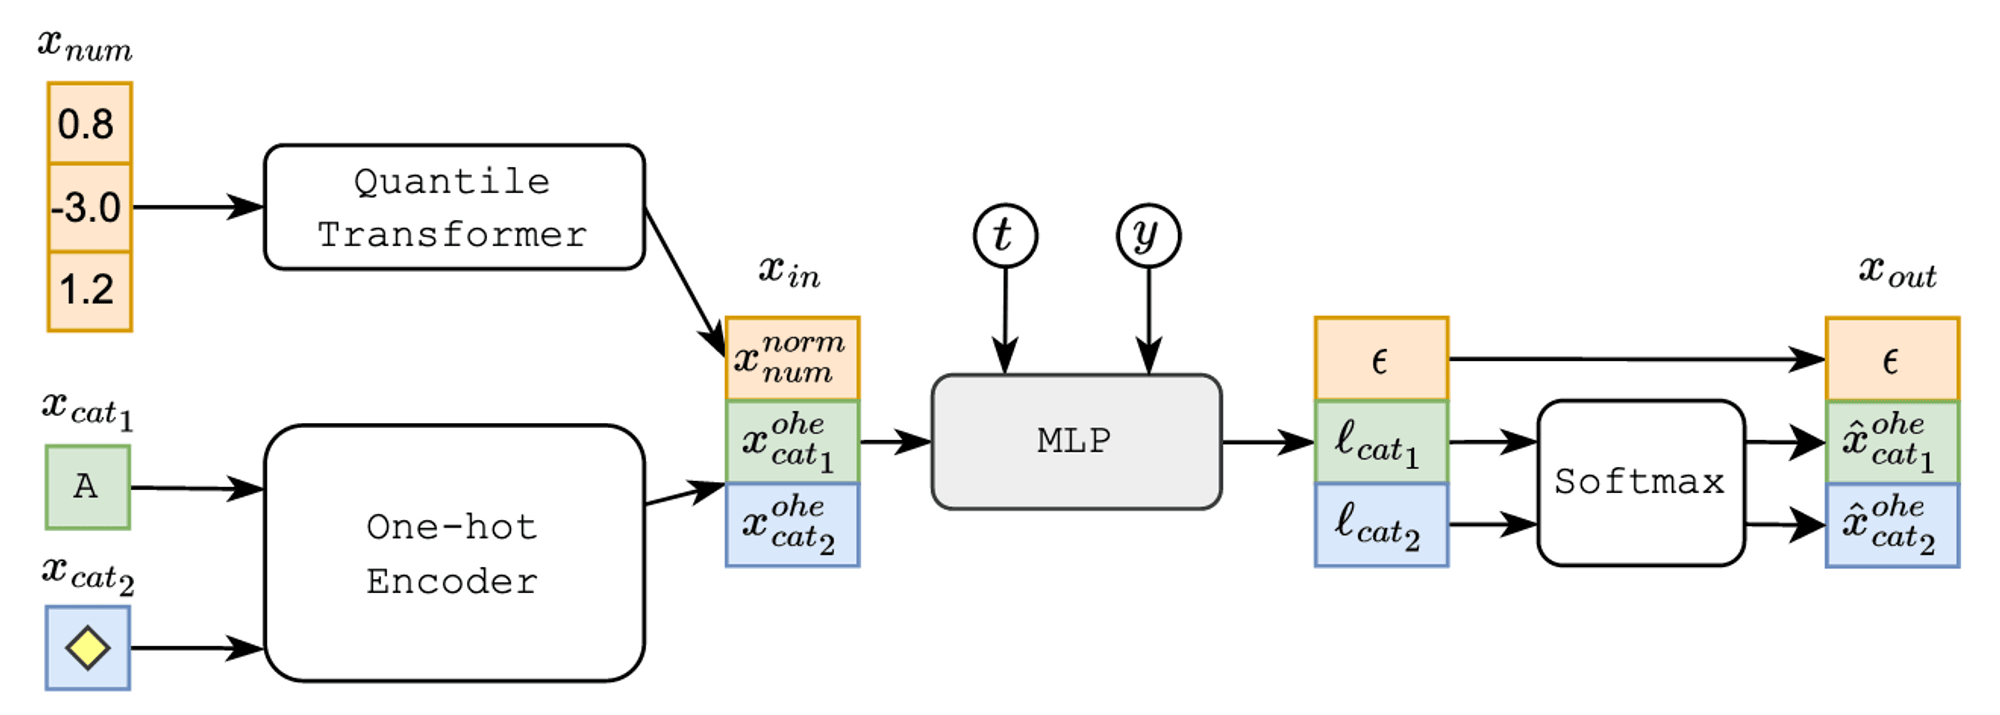
TabDDPM scheme for classification problems; $t, y, l$ denote a diffusion timestep, a class label, and logits, respectively.
You can see above a general scheme of our approach for classification problems. Note that MLP model outputs logits for categorical features and the predicted noise \epsilon for numerical features. To understand better how diffusion models are usually trained, refer to [4], [6]. Target feature $y$ is generated with respect to the class proportion from train data. For regression tasks we just consider $y$ as an additional numerical feature.

Experiments The link has been copied to clipboard

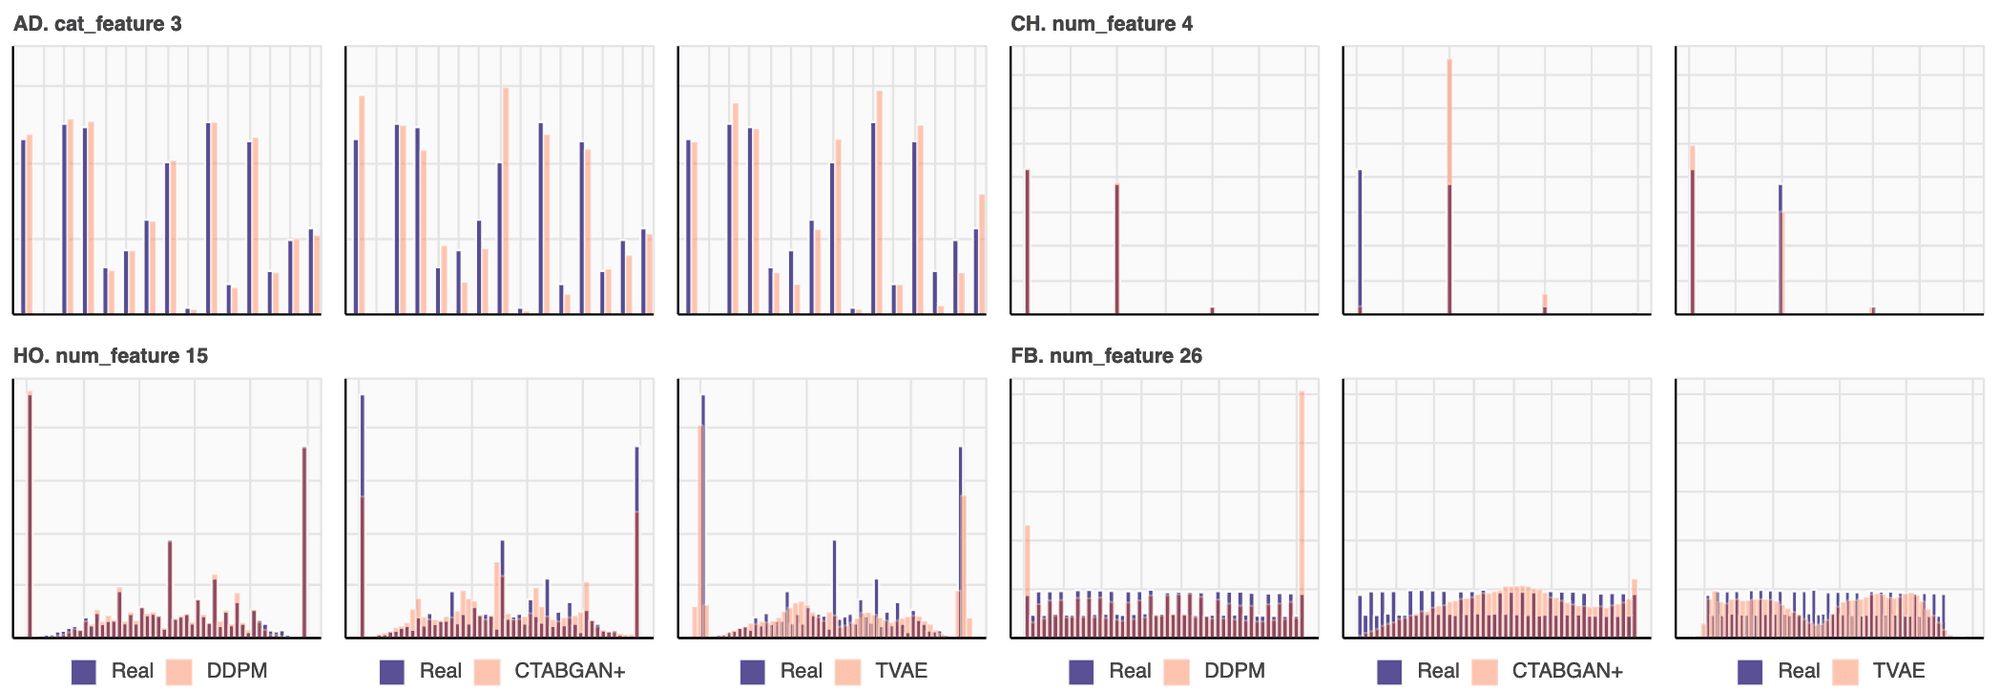
First, we visualize the distributions of some features. In most cases, TabDDPM produces more realistic feature distributions compared to TVAE and CTABGAN+. We found that the advantage is more pronounced (1) for numerical features, which are uniformly distributed, (2) for categorical features with high cardinality, and (3) for mixed type features that combine continuous and discrete distributions. (for additional pictures, see Figure 2 from [1]).
The individual feature distributions for the real data and the data generated by TabDDPM, CTABGAN+, and TVAE. TabDDPM produces more realistic feature distributions than alternatives in most cases.
The results of machine learning efficacy evaluation can be found in the table below. The mean ranks averaged over 16 datasets are reported (lower is better). We compare TabDDPM with some GAN-based and VAE-based approaches. Additionally, we adapt SMOTE as a baseline, i.e. synthetic sample is generated using linear interpolation of two real samples.
 

Average rank

(1-best, 5-worst)

std
TabDDPM1.560.60
SMOTE1.750.84
CTABGAN+3.631.02
TVAE3.810.83
CTGAN4.251.06
Main takeaways from ML efficiency evaluation:
  • TabDDPM significantly outperforms GAN and VAE baselines on most datasets, which highlights the advantage of diffusion models for tabular data as well as demonstrated for other domains in prior works.
  • The interpolation-based SMOTE method demonstrates the performance competitive to TabDDPM and often significantly outperforms the GAN/VAE approaches. Many papers overlook this simple baseline.
We compare TabDDPM with SMOTE in terms of DCR since they show almost equal performance in terms of ML utility, while GAN/VAE-based approaches perform much worse. The result for privacy evaluation are presented below. Low DCR values (and higher ranks) indicate that all synthetic samples are essentially copies of some real datapoints, which violates the privacy requirements. In contrast, larger DCR values indicate that the generative model can produce something “new” rather than just copies of real data.
 

Average rank

(1-best, 2-worst)

std
TabDDPM1.030.13
SMOTE1.970.13
Main takeaway from privacy evaluation:
The table shows that TabDDPM is superior in privacy. This experiment confirms that TabDDPM’s synthetic samples, while providing high ML efficiency, are also more appropriate for privacy-concerned scenarios.
Additional thoughts
  • Strong classification/regression models, like CatBoost, are crucial for ML efficiency evaluation. In our paper [1], we show that evaluation using average score across multiple weak models (this method was popular in prior works) may be misleading.
  • It is important to note that DCR is not a perfect privacy metric, and it is hard to come up with a new one. However, we still consider TabDDPM a step forward in high-quality and private generation.
Conclusion The link has been copied to clipboard

The field of tabular generation is challenging and can be useful in privacy-oriented tasks. In our experiments, we found that TabDDPM produces high-quality synthetic tabular data and can be used for privacy-preserving data sharing. We also demonstrate its effectiveness on several benchmark datasets and compare it to other state-of-the-art approaches. Overall, we believe that TabDDPM is a promising direction for generative modeling of tabular data and can have practical applications in various domains. A source code can be found here: tab-ddpm.